
This is a guest post by the AMZScout team.
An AI assistant can only judge a product by the data it can reach. Ask Claude or ChatGPT whether a product is worth launching, and without live Amazon data it falls back on the web and third-party estimates. Connect it to a marketplace data source, and the same question returns current sales, prices and competitors for real ASINs.
Below, the same question is asked both ways. Then come four checks to run before you put money into inventory, and a final step that AI tools for Amazon sellers can't complete without your own costs: the margin.
All examples were run in Claude Opus 5.5 (medium effort) on October 15, 2026, using Amazon US data. Each prompt was asked in a new chat, so no answer relies on an earlier one.
What an AI Assistant Sees Without Live Amazon Data
Both runs used the same question:
Prompt: Is a dog lick mat a good product to sell on Amazon right now? How many units does the top listing sell per month?
The first run had no Amazon connector, and Claude searched the web. Its figures came from third-party pages dated March to July 2026, so the answer said nothing about October. The top ASIN changed depending on which page and search term it used, and the final estimate was a range of 7,000 to 10,000 units a month. Claude was honest about the gap. It said it could not verify October sales, the review counts of the top listings, or landed cost and fees, and that those decide profitability.
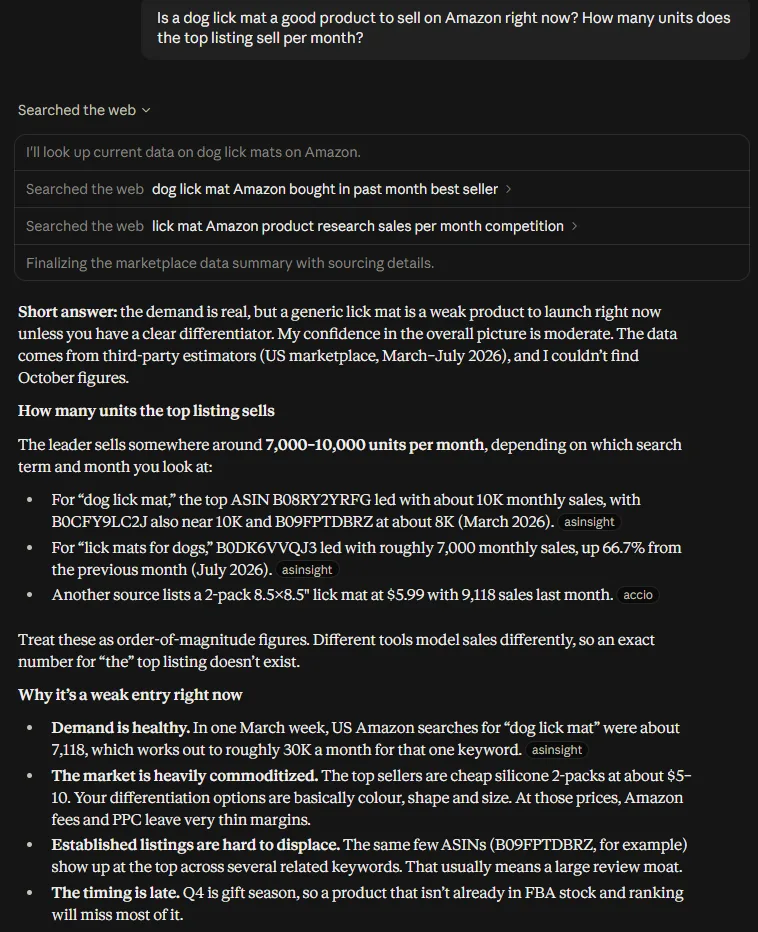
Claude Opus 5.5, no Amazon connector. The answer is assembled from third-party pages dated March to July 2026.
The second run, in a new chat, had the AMZScout connector on. Claude called the niche tool, pulled the top 50 listings that day and named a top listing: the LUKITO 3-pack (B0BXRZKNBB) at about 8,790 units a month.
It also flagged that number as suspect. The listing has only 45 reviews, and several LUKITO listings show nearly identical estimates, so the tool is probably counting sales shared across a family of linked variants. For the niche as a whole, it reported about 96,000 units and $1.18 million a month across the top 50, a median of around 1,800 units per listing, and 16 brands. As check 4 shows, a total like this can count some variation families more than once.
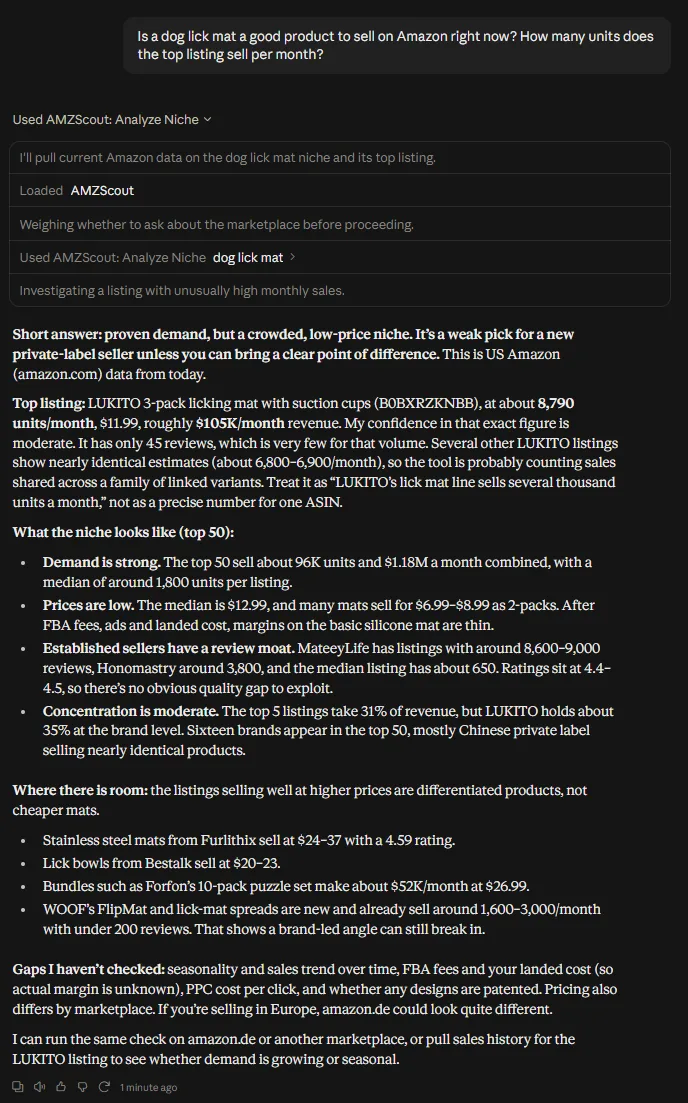
Claude Opus 5.5, AMZScout connector. Same question, current data for named ASINs.
The answer closed with a list of gaps: seasonality and sales trend, FBA fees and landed cost, PPC cost, and patents. The rest of this article works through most of that list.
The connector works in ChatGPT as well. The wording and depth of the answers will differ between assistants, but the data they pull is the same.
Account Data vs Market Data
One type of AI for Amazon sellers is an account connector, like the MCP server SellerLegend offers. It reads your own seller data (sales, profit, inventory and PPC) and answers the question "How is my business doing?"
A product you haven't launched yet has no account history, so the questions shift to other sellers' listings: how much they sell, when they launched, what they charge, how many reviews they hold. That takes a market data connector such as AMZScout MCP.
QuestionAccount data (SellerLegend MCP)Market data (AMZScout MCP)
What did my SKUs net this month? | Yes | No
Is this niche growing or shrinking? | No | Yes
How fast did a new competitor grow? | No | Yes
4 Checks to Run Before You Order Inventory
Each prompt below is the exact one used for the example. To run it on your own idea, swap in your ASIN or keyword.
1. Is demand stable or seasonal?
Start with the product you would compete with: two years of its monthly sales.
Prompt: Show me the monthly sales history for B0B178VDQQ on Amazon US for the last 2 years. Is demand stable or seasonal?
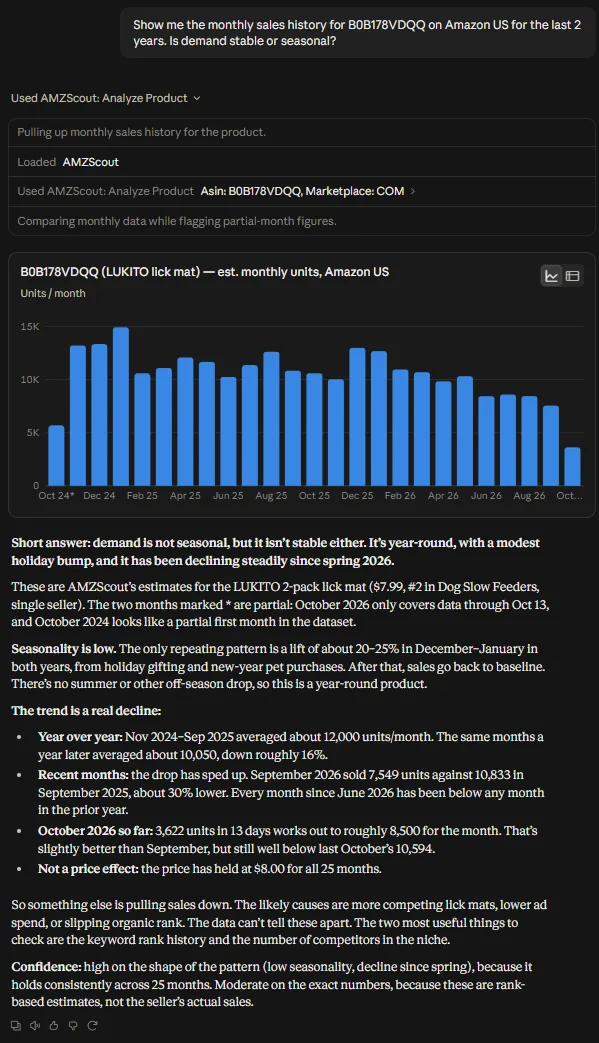
The LUKITO 2-pack (B0B178VDQQ) sells year-round. The only repeating pattern is a 20 to 25% lift in December and January. The trend is a decline: November 2024 to September 2025 averaged about 12,000 units a month, and the same months a year later averaged about 10,050, down roughly 16%. September 2026 came in about 30% below September 2025. The price held at $8 for all 25 months, so this was not price-driven.
Claude also caught that October 2026 covered only 13 days of data and projected the month at roughly 8,500 units instead of reading it as a crash. The takeaway: a year-round product with large volume that has been losing ground, and faster since spring.
2. Are new sellers still winning?
The leader's history tells you little about your own chances. For Amazon competitor analysis, the better test is how recent entrants did.
Prompt: Compare B0GRCPN2V5, B0B178VDQQ and B0DKX6YJNF on Amazon US: launch dates, how fast sales grew, and how prices changed.
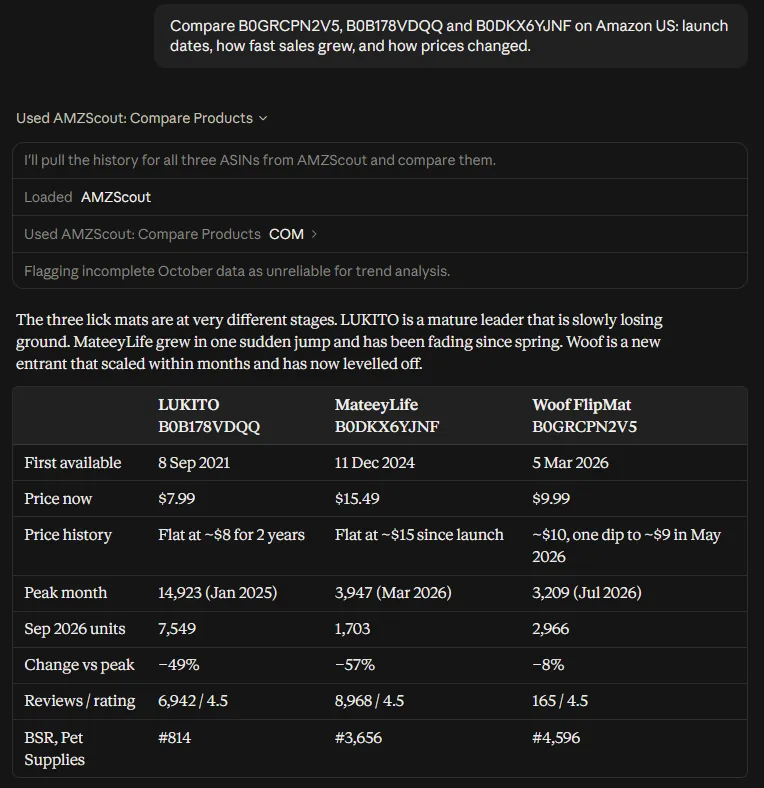
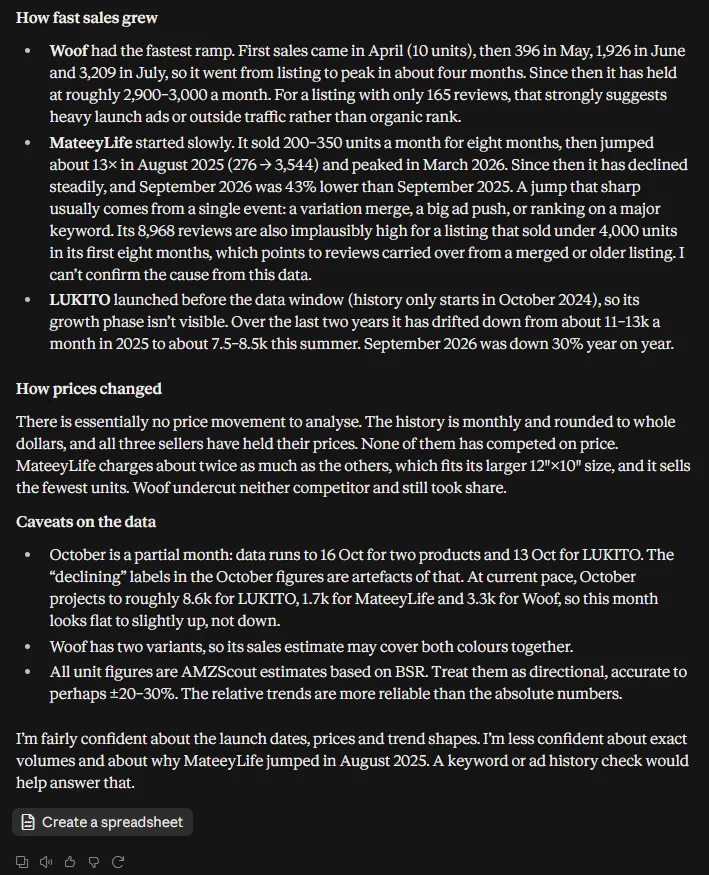
Woof FlipMat (B0GRCPN2V5), a dual-sided mat, went live on March 5, 2026. It sold 10 units in April, 396 in May, 1,926 in June and 3,209 in July, and has held at about 2,900 to 3,000 a month since. It did that at $9.99, without undercutting the leader, and with 165 reviews. Claude read the low review count as a sign of launch ads or outside traffic rather than organic rank.
MateeyLife's XL mat (B0DKX6YJNF) shows a different path: eight slow months, a 13-fold jump in August 2025, then a steady decline since March 2026. Claude noted that its 8,968 reviews are too many for a listing that sold under 4,000 units in its first eight months, a sign of reviews carried over from another listing, but said it couldn't confirm the cause. Its curve is the warning in this check: it lost more than half of its peak volume within six months.
The takeaway: a new brand can still reach about 3,000 units a month here within four months, though that figure may include both of Woof's color variants. It took a product that differs from the standard 2-packs and, most likely, a launch budget.
3. Is the price band holding?
Flat prices and falling prices call for different plans, so check both the current band and how it has moved.
Prompt: What price range do the top dog lick mats on Amazon US sell at, and have prices changed over the last 2 years?
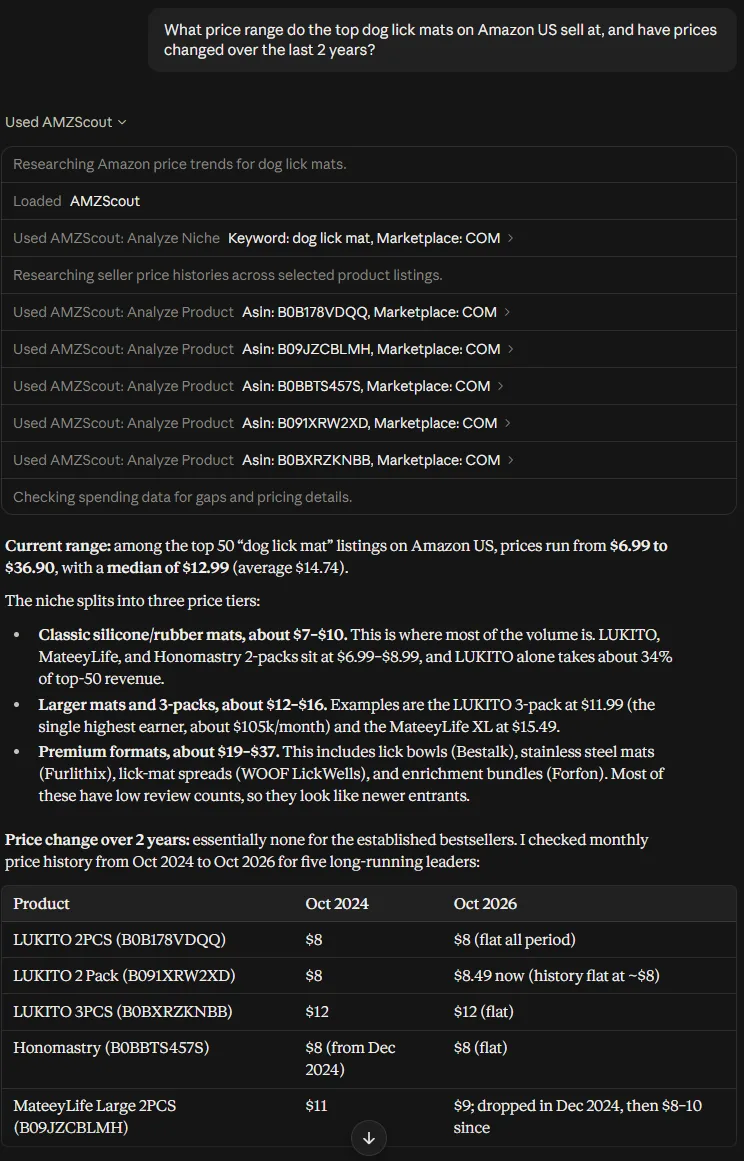
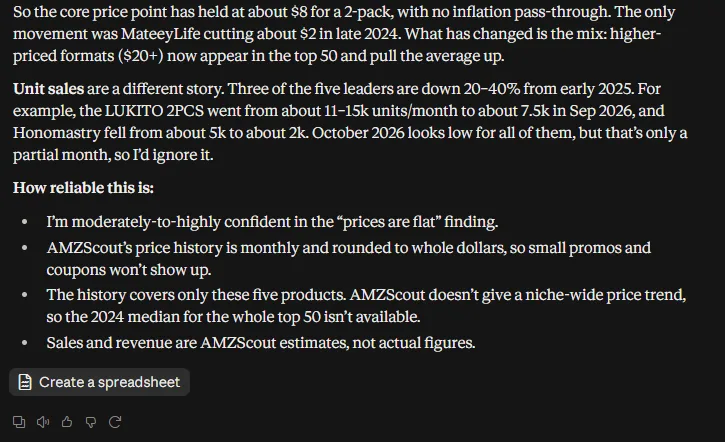
Across the top 50 listings, prices run from $6.99 to $36.90 with a median of $12.99. Claude split the niche into three tiers: classic silicone mats at about $7 to $10, where most of the volume sits; larger mats and 3-packs at $12 to $16; and premium formats at $19 to $37, such as lick bowls, stainless steel mats, lick-mat spreads and bundles.
Over two years, the leaders barely moved. The LUKITO 2-pack stayed at $8, and the only notable change was MateeyLife cutting about $2 in late 2024. Claude added a caveat: the price history is monthly and rounded to whole dollars, so coupons and short promotions don't show.
The takeaway: there is no price war, but prices haven't risen with inflation either. A copy of the LUKITO 2-pack would sell in the lowest price tier, so the margin step below matters most for it.
4. Do the sales estimates hold up?
Every sales figure above is an estimate based on sales rank. Before a number goes into your forecast, test it against reviews.
Prompt: Is the sales estimate for B0BXRZKNBB on Amazon US realistic? Compare its reviews and sales history with B0B178VDQQ.
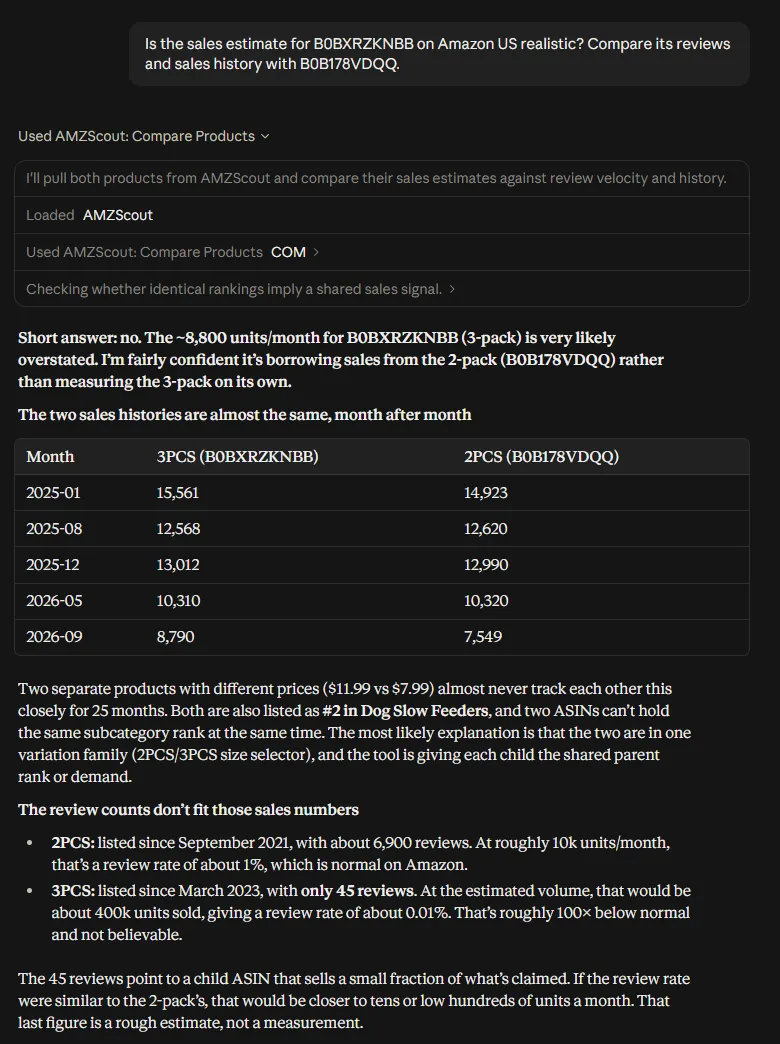
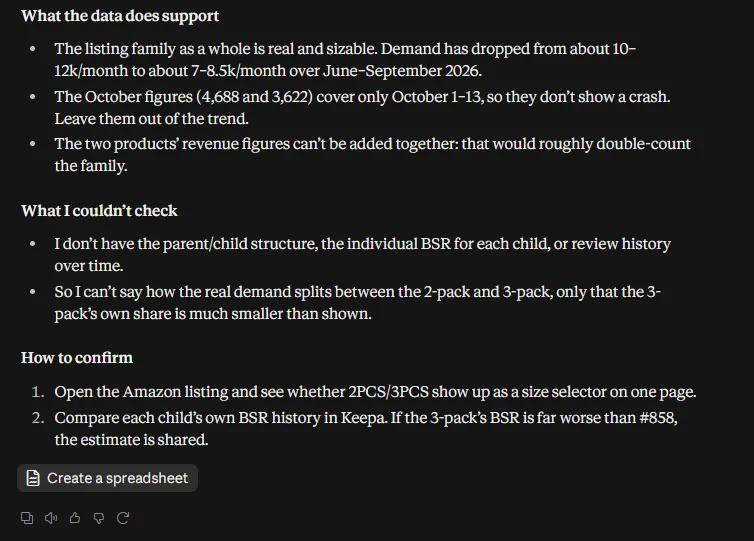
The answer was no. The two LUKITO listings have tracked each other almost exactly for 25 months, and both rank #2 in Dog Slow Feeders, which two separate ASINs can't do at once. The review math confirms it. The 2-pack has about 6,900 reviews on roughly 10,000 units a month, a review rate near 1%. The 3-pack has 45 reviews on an estimate of about 400,000 units sold, a rate around 0.01%.
The likely explanation is a variation family, where each child listing shows the parent's rank. That has a practical consequence: adding the two revenue figures together would double-count the family, and the "top listing" from the first answer is much smaller than it looks. It also means the sales history in check 1 is best read as demand for the LUKITO family, not for one listing.
Run the Numbers Before You Commit
The four checks tell you whether the market works. They don't tell you whether your version of the product makes money. That part needs your own costs.
Run your sale price, product cost, inbound shipping, ad cost per unit and package dimensions through an FBA profit calculator once for each price tier from check 3, since each tier is a different product with its own costs. Check 2 also suggested the fastest new entrant grew on launch ads or outside traffic, so work out the highest ACoS your price can carry before you plan a launch.
Where the Answers Need a Second Look
The runs above show five traps to watch for:
- Partial months. Mid-month data makes the current month look like a crash. Claude prorated October here, but ask for this if your assistant doesn't.
- Shared estimates. Variation families can repeat the same sales figure on every child listing. Summing a niche's revenue without checking this inflates it.
- Shared reviews. Merged listings can carry reviews from older products, so a review count is not always a measure of that listing's history.
- Estimates, not actuals. Claude put the accuracy of the unit figures at roughly ±20 to 30%. Trends and comparisons are more reliable than any single number.
- What the data can't see. The reason behind a sudden jump, actual PPC costs and patents all sit outside sales data.
A simple rule helps: ask the assistant how confident it is and what it couldn't check. In these runs Claude stated its confidence every time and named most of the gaps without being asked. Other models and settings may not.
The Verdict on Dog Lick Mats
Put together, the four checks give a mixed read. Demand is real and year-round, but the leader has been slipping, and faster since spring. Prices haven't moved in two years, and most of the volume sits at $7 to $10. A new brand broke in at $9.99 within four months, with a dual-sided design and, most likely, launch ads or outside traffic behind it.
That makes a copy of the standard silicone 2-pack the weakest option. It would sell in the lowest price tier, against established listings that are losing volume: three of the five leaders Claude reviewed in check 3 are down 20 to 40% in unit sales from early 2025. Woof shows the alternative: a product that looks different, priced above the LUKITO 2-pack rather than below it. Whether that works at $10, $15 or $25 is a question for the profit calculator, and the order should wait until the margin survives launch ad spend.
Key Takeaways
- Without live data, an AI assistant answers product questions from whatever third-party pages it finds, often months old. With a market data connector, it answers from current listings.
- Account connectors such as SellerLegend's MCP cover a business you already run. A product you haven't launched needs market data.
- Four checks cover the market side of the decision: demand and seasonality, how recent entrants did, the price band, and whether the sales estimates hold up.
- Test sales estimates against review counts, keeping in mind that merged listings can share reviews, and leave partial months out of any trend.
- Finish in a profit calculator. Market data shows whether a niche works, and only your costs show whether your product does.


