Cash Is King on Amazon: Shrinking Your Cash Conversion Cycle (CCC) From 120 Days to 45
Most sellers focus on revenue and profit, but what really keeps your business alive is cash flow. On Amazon, the time between paying your supplier and seeing that money back in your bank account (the Cash Conversion Cycle, or CCC) often stretches 100+ days. That’s why so many sellers feel profitable “on paper” but broke in reality.
This guide shows you, step by step, how to reduce your CCC — sometimes from 120 days down to 45 — so you can reinvest faster, scale harder, and sleep easier.
🗺 Step 1 — Map Your Cash Timeline
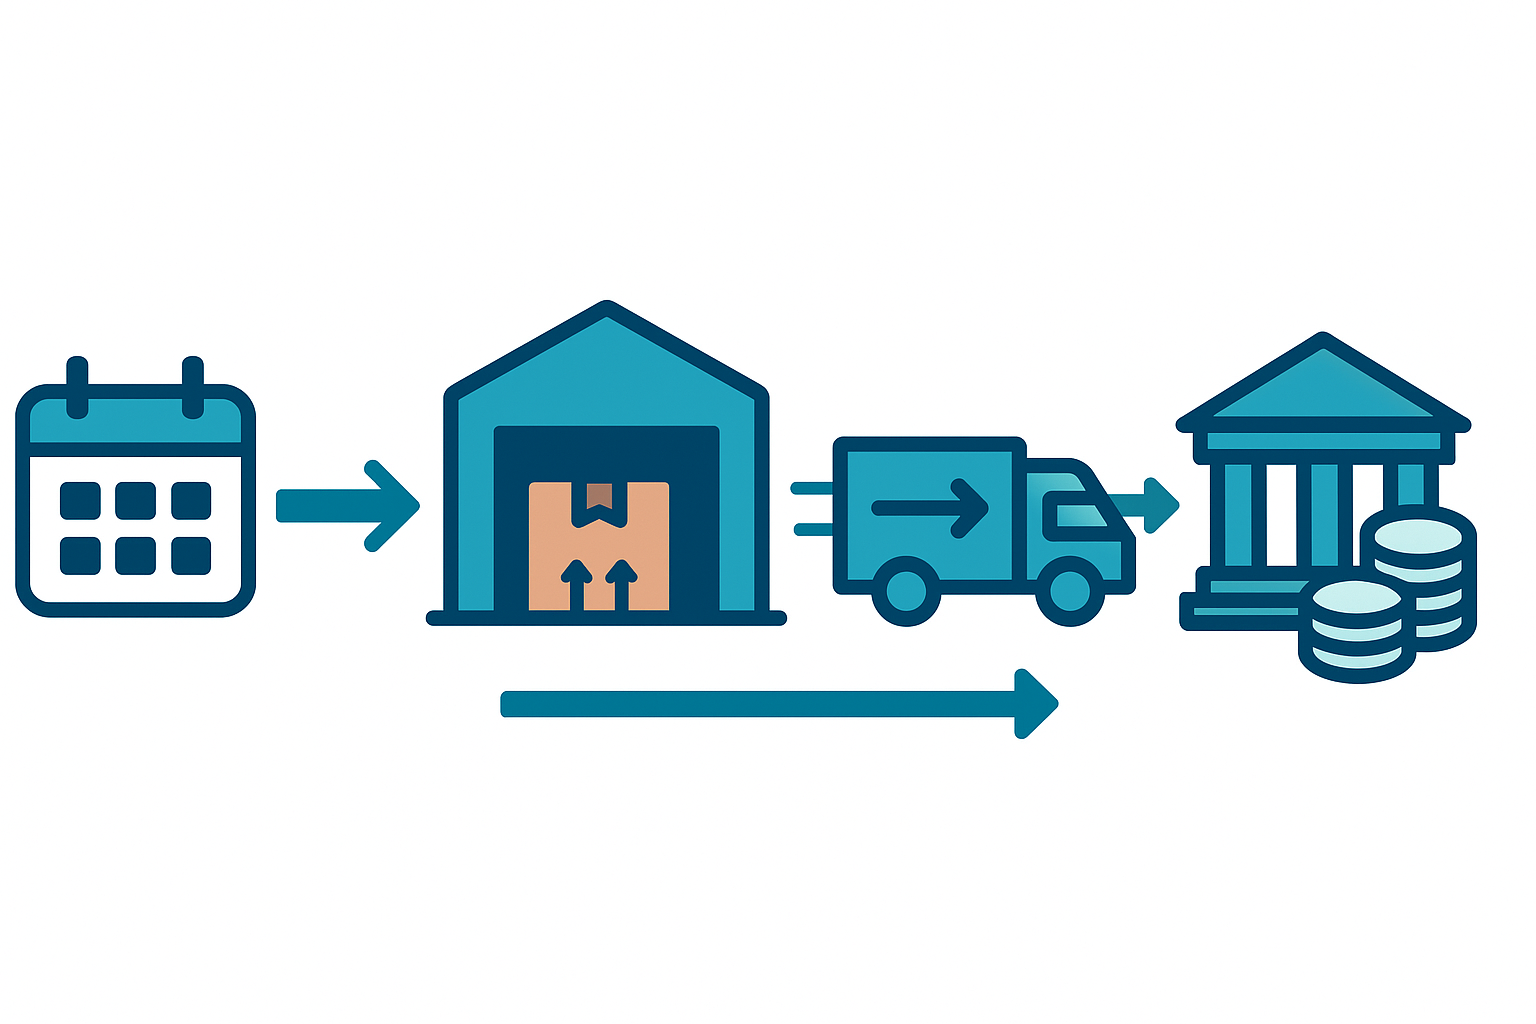
Before you fix your cash cycle, you need to see where the time disappears. Amazon’s payout schedule hides several lags.
How to map it:
- Pick your top 10 SKUs (don’t do everything at once).
- Write down these dates for each SKU:
- 📦 PO Date → When you placed the purchase order with your supplier.
- 🏭 FC Inbound Date → When Amazon checks in your shipment.
- 🛒 First Sale Date → When the first customer buys your item.
- 🚚 Delivery Date → When the order is delivered (Amazon’s payment clock starts here).
- ⏳ Delivery +7 → Amazon holds funds for 7 days after delivery (standard “DD+7” reserve).
- 💵 Disbursement Date → When Amazon releases funds into your Payments account.
- 🏦 Bank Deposit Date → Add 2–5 days for funds to clear in your bank.
Example (Garlic Press SKU):
- PO Date: March 1 ($2,000 sent to supplier).
- FC Inbound: March 25.
- First Sale: April 2.
- Delivery: April 4.
- Delivery +7: April 11.
- Disbursement: April 15.
- Bank cleared: April 17.
👉 Total = 47 days (March 1 → April 17).
Do this for your top SKUs — the gaps will shock you.
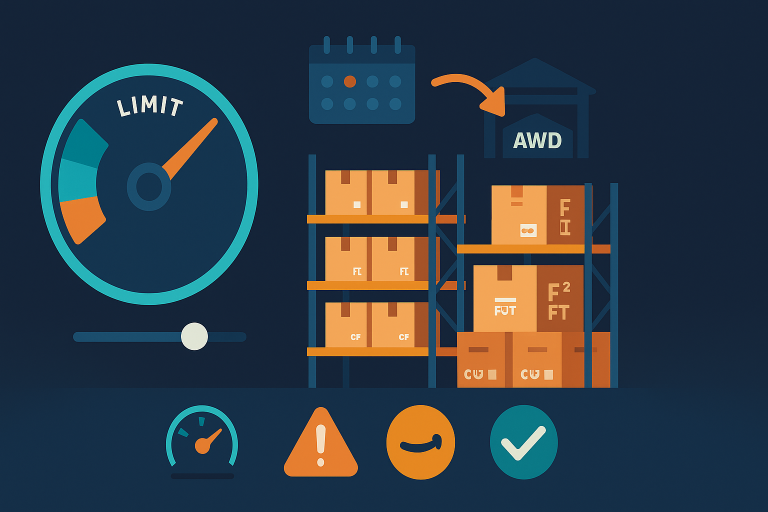
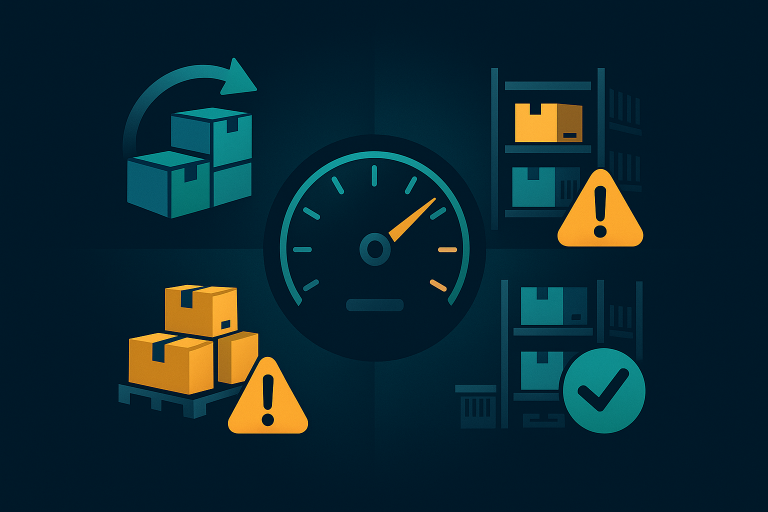
🏭 Step 2 — Slash Time Stuck in Fulfillment Centers
Amazon charges monthly storage fees and, worse, Aged Inventory Surcharges starting at 181 days and escalating past 365 days. The longer inventory sits unsold, the more your cash is locked up and taxed.
Action Plan:
- Ship in leaner, more frequent replenishments instead of bulk shipments that sit.
- Watch for SKUs creeping into 181/365 days. Amazon increases fees significantly at those points.
- Improve sell-through with:
- Competitive pricing (even small price drops accelerate cash return).
- Sponsored Products ads to boost velocity.
- Listing optimization (main image, title, bullets).
SellerLegend tip: In Inventory Health, set alerts for SKUs about to cross the 181-day threshold.
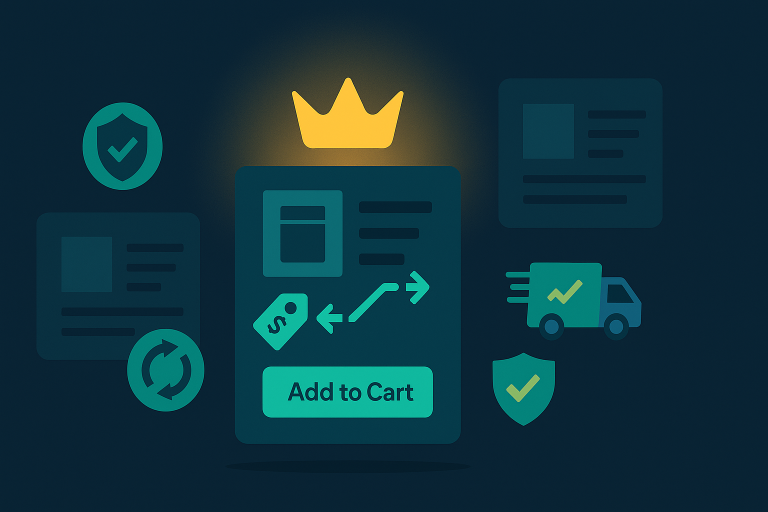
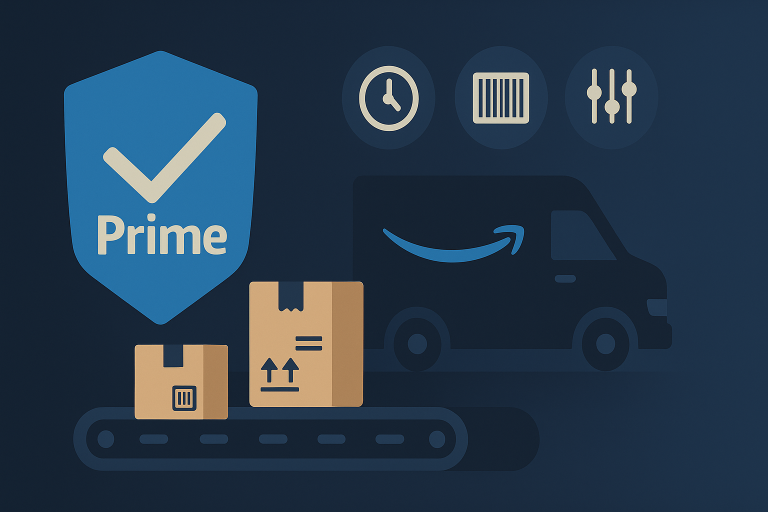
🚚 Step 3 — Speed Up “Delivery → Cash”
Amazon pays 7 days after delivery, not after the sale. That means faster delivery speeds = faster cash.
Practical tweaks:
- Prioritize Prime-eligible offers with 1-2 day delivery windows.
- Use regional inventory placement (when available) to reduce delivery lag.
- Track the difference between “Delivered” → “Available for Disbursement” in your Amazon Payments report. If it’s consistently longer than 7 days, dig into shipping speed promises.
🔒 Step 4 — Plan for Reserves (Don’t Be Surprised)
Amazon often withholds a portion of your balance as a reserve against returns and claims. Sellers who don’t plan for this are blindsided.
What to do:
- In your Payments Dashboard, check the “Account Level Reserve” line each cycle.
- Track the reserve as a % of gross receivables — if it’s rising, review your return rate and Order Defect Rate.
- Build a cushion: assume 5–10% of funds may be held back at any given time.
SellerLegend tip: Use the Settlement Periods screen to model how much of each payout is “real cash” versus “held in reserve.”
💸 Step 5 — Explore More Frequent Disbursements
By default, Amazon pays every 14 days (with reserves). Some established sellers may qualify for more frequent disbursements (daily or weekly).
Check:
- In Settings → Account Info → Deposit Method, look for “Request Disbursement.”
- If eligible, test weekly disbursements to smooth cash flow and reduce surprises.
📊 Metrics to Watch Weekly
To stay on top of your CCC, review these every week:
- 🏷 Days of inventory on hand per SKU (avoid hitting 181+ days).
- ⏱ Average “Delivery → Available for Disbursement” days.
- 🔒 Reserve as % of gross receivables.
🛠 SellerLegend Workflow
Here’s how to run this entire system in SellerLegend:
- Settlement Periods + P&L: See DD+7 lags and reserve carry-overs clearly.
- Inventory Health: Monitor SKUs aging into 181/365 days with alerts.
- Cash Plan Tile: Forecast receipts = (Delivered units × ASP – fees) shifted by 7–12 days.
- Variance Tile: Compare forecast vs actual disbursements.
🎯 The Payoff
If you follow these steps, you’ll go from waiting 100–120 days for cash to recycling it in 40–50 days. That means every £10,000 in inventory could spin 2–3 times faster through your business each year — without new capital, loans, or outside investors.
That’s the difference between running out of cash … and running a scalable Amazon business.
👉 Next step: Try mapping just one SKU’s cash timeline today. Once you see the full picture, you’ll never look at payouts the same way again.
🧩 FAQ & Advanced Notes
❓ What if my SKU already sells every day?
Great question. When you have steady-selling products with rolling replenishments, you can’t always tell if a specific sale came from your latest inbound shipment or older stock.
Here’s how to handle it:
- New SKUs / launches → Track shipment-by-shipment. Your CCC is clean: PO → inbound → first sale → delivery +7 → disbursement.
- Mature SKUs → Use aggregate CCC at SKU or account level: measure how long, on average, your inventory ties up cash before being converted back into sales.
📊 Aggregate CCC Formula
CCC=Average Inventory ValueCOGS/dayCCC = \frac{\text{Average Inventory Value}}{\text{COGS/day}}CCC=COGS/dayAverage Inventory Value
- Average Inventory Value = (Opening Inventory Value + Closing Inventory Value) ÷ 2
- COGS/day = Cost of Goods Sold ÷ Number of Days in Period
This formula tells you: How many days, on average, inventory sits in your business before being converted into sales.
📝 Worked Example
Let’s say you want to calculate CCC for April.
Dollar-based calculation
- Opening Inventory Value (1 April): $60,000
- Closing Inventory Value (30 April): $40,000
- COGS (April): $90,000
- Period length: 30 days
Step 1: Average Inventory Value
(60,000 + 40,000) ÷ 2 = 50,000
Step 2: COGS per day
90,000 ÷ 30 = 3,000 per day
Step 3: CCC
50,000 ÷ 3,000 = 16.7 days
👉 On average, every $1 invested in inventory takes about 17 days to turn back into revenue.
Unit-based calculation (same logic)
- Opening Inventory: 6,000 units
- Closing Inventory: 4,000 units
- Units sold in April: 9,000 units
- Period length: 30 days
Step 1: Average Inventory Units
(6,000 + 4,000) ÷ 2 = 5,000 units
Step 2: Units sold per day
9,000 ÷ 30 = 300 units per day
Step 3: CCC
5,000 ÷ 300 = 16.7 days
👉 On average, each unit of inventory sits in Amazon for about 17 days before being sold.nventory for about 17 days before being converted into sales revenue.
🔄 SellerLegend Application
- In Settlement Periods + P&L, you already have COGS for the period.
- In Inventory Health, you can track opening and closing stock values.
- SL could even calculate CCC automatically:
- Input: Inventory valuations + COGS
- Output: “Average CCC in days” per SKU or account-wide
⚖️ When to use which method
- Shipment-by-shipment CCC → Best for new SKUs, launches, or troubleshooting specific suppliers.
- Aggregate CCC → Best for mature SKUs with continuous sales; gives you the big picture and is easier to update monthly.