The Real Profit Formula: From ACoS to TACoS (and why your “profitable” SKU isn’t)
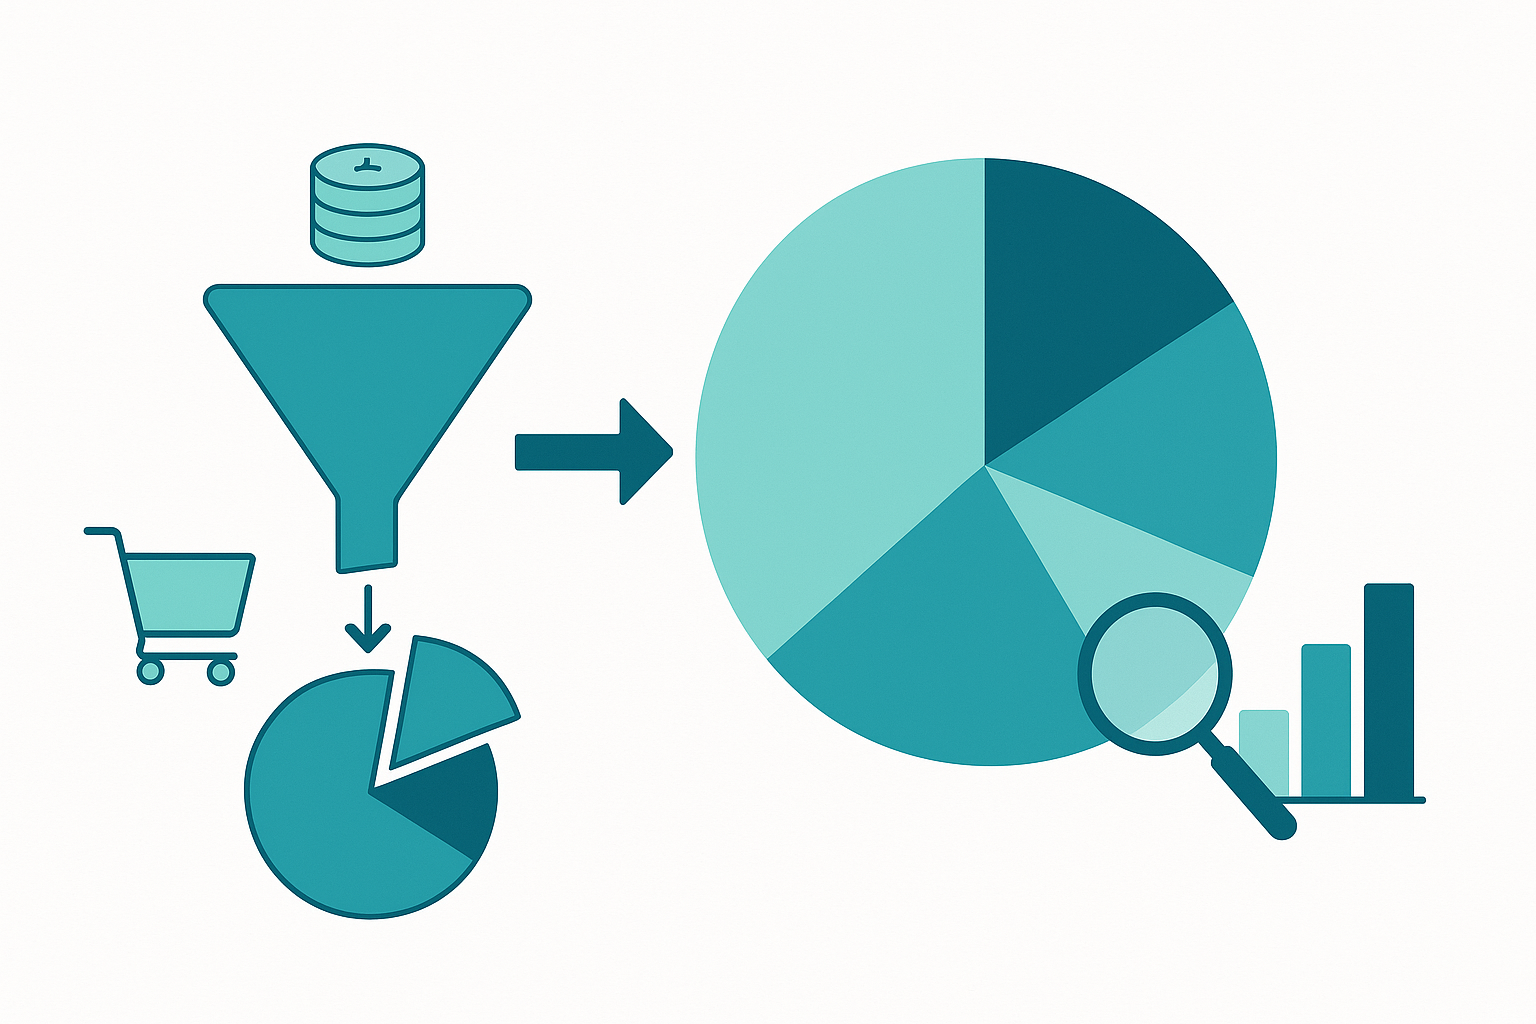
Most sellers watch ACoS and feel good when it’s low. But your bank balance cares about TACoS—ad spend divided by total sales (ad-attributed + organic).
ACoS = Ad Spend ÷ Ad-attributed Sales
TACoS = Total Ad Spend ÷ Total Sales (same period).
🧭 Quick orientation: ACoS vs TACoS
- ACoS focuses on ad-attributed sales only and tells you if ads are efficient at generating ad sales. Great for campaign tuning… but it can lie about business health.
- TACoS uses all sales and tells you if ad spend is helping the entire business (ad + organic).
- If TACoS trends down while revenue holds or rises, ads are strengthening organic sales;
- if TACoS climbs, you’re buying growth that doesn’t stick.
🧮 Step 1 — Build a one-page unit-economics sheet (per SKU)
You need the truth per unit, not just ratios.
Inputs (per unit):
- Landed cost (product + freight + duties)
- Amazon fees (referral %, FBA fulfillment)
- Storage/aged-inventory exposure if you’re slow moving (fees escalate from 181+ days).
- Returns allowance (your historical %)
- Ad spend per unit (see Step 3)
Outputs (per unit):
- Gross profit = Price – (referral + FBA + storage/aged est. + returns + landed)
- Ad-adjusted profit = Gross profit – Ad spend per unit
- Margin % = Ad-adjusted profit ÷ Price
Keep this in a tiny table in SellerLegend or Sheets. It’s your “lie detector.”
🔎 Step 2 — Get clean totals for TACoS
Choose a period (e.g., last 28 days) and collect:
- Total Sales (ad + organic) — your SellerLegend P&L / orders total for the period.
- Total Ad Spend (Sponsored Products + Sponsored Brands + Sponsored Display for the same period).
- TACoS = Total Ad Spend ÷ Total Sales.
- ACoS (optional) = Ad Spend ÷ Ad-attributed Sales (for campaign-level tuning).
Attribution window note: Amazon Ads uses a 14-day lookback for attribution in its reporting, which can make ad sales vs order totals look out of sync. Align comparisons to the same windows.
🧪 Worked example A — “Great ACoS, bad TACoS”
Period: 28 days
Price: $25
Landed: $7.00
Referral (15%): $3.75
FBA fee: $4.30 (check your size tier; this is an example)
Returns allowance: $0.50
Storage/aged est.: $0.10 (fast mover)
Campaign stats:
- Ad spend: $2,400
- Ad-attributed sales: $12,000 → ACoS = 2,400 ÷ 12,000 = 20%
- Total sales (ad + organic): $18,000 → TACoS = 2,400 ÷ 18,000 = 13.3%
Per-unit economics (720 units total @ $25):
Revenue per unit: $25.00
Total fees & cost per unit: $7.00 + 3.75 + 4.30 + 0.50 + 0.10 = $15.65
Gross profit per unit (pre-ads): $25.00 – 15.65 = $9.35
Ad spend per unit: $2,400 ÷ 720 = $3.33
Ad-adjusted profit/unit: $9.35 – 3.33 = $6.02 (≈ 24.1% margin)
Why this can still be bad: If last month TACoS was 9% and now it’s 13.3% while total sales barely moved, you’re leaning harder on ads without organic lift. Next step: cut non-converting queries (see Step 4), improve listing conversion, or reprice.
🧪 Worked example B — “Higher ACoS, better TACoS”
Period: next 28 days, same SKU
- Ad spend: $2,800
- Ad-attributed sales: $11,200 → ACoS = 25% (worse!)
- Total sales: $24,000 → TACoS = 11.7% (better!)
You deliberately pushed on branded + best converting queries and refreshed main image; organic picked up. Even with a worse ACoS, overall the brand is more efficient. That’s why TACoS is your north star.
🧰 Step 3 — Get your Ad spend per unit right
- Compute spend ÷ total units sold in the same period (ad + organic).
- If you’re in a launch phase, set a temporary TACoS target that tolerates higher spend (e.g., 15–20%) and step it down as reviews/organic pick up. [Strong Inference]
🧵 Step 4 — Use Search Query Performance (SQP) like a diagnostic scope
SQP shows query → impressions → clicks → cart adds → purchases for your brand/ASINs (Brand Registry required; available in Brand Analytics and via SP-API analytics reports).
One-hour weekly routine:
- Pull top 20 queries by impressions; tag branded/non-branded.
- Find leaks:
- Clicks high, carts low → fix title/image/price; or pause these queries.
- Carts high, purchases low → delivery promise/price/competitors.
- Shift budget to proven, converting queries; cut the rest.
- Re-read TACoS in 1–2 weeks at the same attribution window you used before.
🧪 Micro-example — spotting a leak with SQP
- Query “stainless water bottle 32 oz” last week: 20k impressions → 1,000 clicks → 60 carts → 25 purchases.
- Click→Cart = 6% (weak for the category). Price is $3 above peers and your hero (main) image doesn’t clearly show the built-in straw, so shoppers skimming search results can’t tell your bottle has that feature—hurting click-through and click→cart.
Fix: New hero image, $1 coupon.
Check back in 7–14 days: If carts and purchases rise while TACoS falls or holds, keep the ad spend; if not, pause that query and reallocate.
📦 Fees matter—model them correctly
Fulfillment fees and referral fees change over time; don’t rely on “old memory.” For US 2025, Amazon announced cost stability and published current fee tables; always plug the current rates into your unit economics.
Slow movers suffer aged inventory surcharges from 181+ days on top of storage—don’t let these invisible costs distort TACoS decisions.
🧷 Guardrails & gotchas
- Attribution timing: Ads may claim sales up to 14 days later; compare periods apples-to-apples.
- Coupons/Promos: These lower net revenue and can spike TACoS even when ACoS looks stable.
- Seasonality/stockouts: Tag periods with anomalies so you don’t make optimization decisions based on conditions you don’t control—seasonality, promos, stockouts, fee changes, competitor shocks, etc. If you “optimize the weather,” you’ll credit your tweaks for gains (or blame them for drops) that were really caused by external factors.
- Launch vs mature SKUs: Launches tolerate higher TACoS; mature SKUs should trend down or flat.
🎯 What success looks like (4–6 weeks)
- TACoS ↓ 2–4 pts, total revenue ↑, unit margin ↔/↑.
- If not, re-audit unit economics (fees), delivery speed promise, and fix the worst SQP leaks first.

